eJournal: uffmm.org, ISSN 2567-6458, 30.Dec 2018
Email: info@uffmm.org
Author: Gerd Doeben-Henisch
Email: gerd@doeben-henisch.de
CONTEXT
In a preceding post I have described a simple way to install the python software as part of a integrated development environment. In this post I show a simple program to simulate the increase/ decrease of a population with nearly no parameters. It can be used as a starting point for further discussions and developments.
HOW TO MAKE IT
Of one has installed (in case of windows) the winpython software as described above and one has selected the ‘spyder.exe’ module from the folder of the winpython software) either directly (by double clicking) or one clicks the icon on the task bar (which one has placed there before), then one has the spyder working environment on the screen.
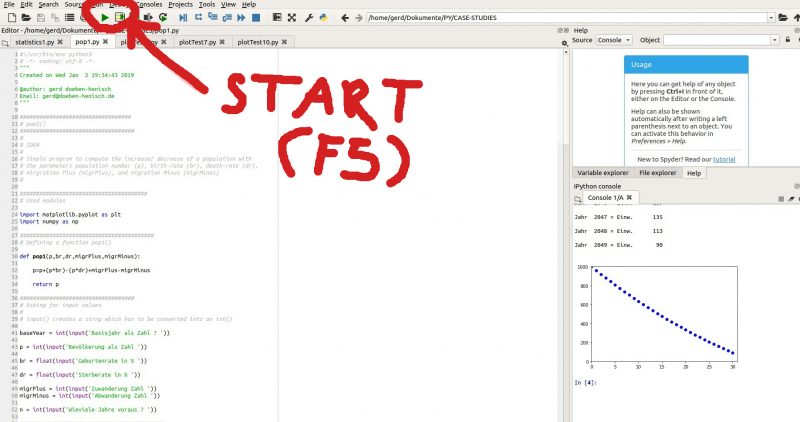
In the left subscreen one can now edit the program (by copy th source code below and paste it into the window) and then one can test the software by clicking on the green run button (alternatively: pressing F5).
Then the python console will be activated in the sub-window in the lower right corner. One has to enter the required values. After the input the console window will show the numbers as well as the graph.
THE PROGRAM SOURCE CODE
#!/usr/bin/env python3
# -*- coding: utf-8 -*-
“””
Created on Wed Jan 2 19:34:43 2019
@author: gerd doeben-henisch
Email: gerd@doeben-henisch.de
“””
##################################
# pop1()
###################################
#
# IDEA
#
# Simple program to compute the increase/ decrease of a population with
# the parameters population number (p), birth-rate (br), death-rate (dr),
# mirgration Plus (migrPlus), and migration Minus (migrMinus)
#
#######################################
# Used modules
import matplotlib.pyplot as plt
import numpy as np
#########################################
# Defining a function pop1()
def pop1(p,br,dr,migrPlus,migrMinus):
p=p+(p*br)-(p*dr)+migrPlus-migrMinus
return p
###################################
# Asking for input values
#
# input() creates a strng which has to be converted into an int()
baseYear = int(input(‘Basisjahr als Zahl ? ‘))
p = int(input(‘Bevölkerung als Zahl ‘))
br = float(input(‘Geburtenrate in % ‘))
dr = float(input(‘Sterberate in % ‘))
migrPlus = int(input(‘Zuwanderung Zahl ‘))
migrMinus = int(input(‘Abwanderung Zahl ‘))
n = int(input(‘Wieviele Jahre voraus ? ‘))
############################################
# processing the data
#
# creating a range called ‘run’ for the years to compute
run = np.arange(1, n+1, 1)
####################################
# pop is a ‘list’ to collect the pop-values for every year
pop = []
########################################
# The first element of pop is the base year
pop.append(p)
######################################
# Compute the changing values for the population p and store these in pop
# Use for this computation the function pop1() defined before
for i in run:
p=pop1(p,br,dr,migrPlus,migrMinus)
pop.append(p)
##############################################
# Print the content of pop for the user to show
# the different years with their pop-values
for i in range(n+1):
print(‘Jahr %5d = Einw. %8d \n’ %(baseYear+i, pop[i]) )
##############################################
# Make the numbers visible as a graph
plt.figure(1)
plt.axis([0, len(run)+1, 1, max(pop)])
run2 = np.arange(0, n+1, 1)
plt.plot(run2, pop, ‘bo’)
plt.show()
plt.close()
EXAMPLE RUNS
EXAMPLE 1
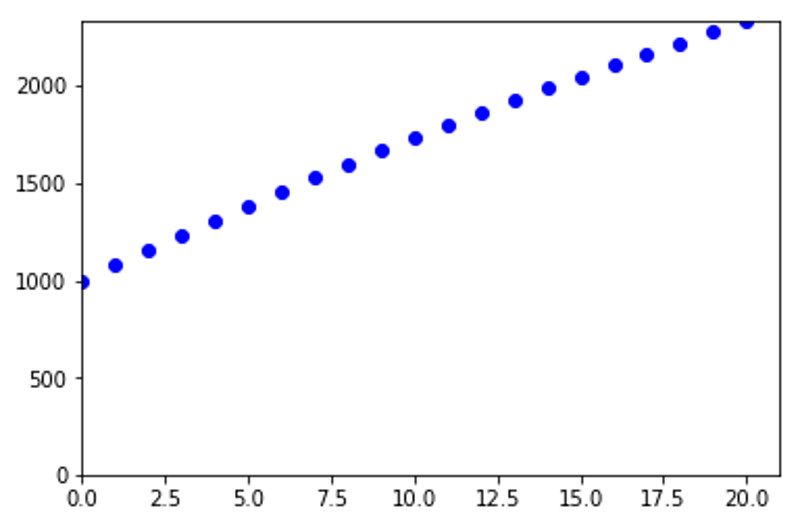
Shows a population with a lower birth rate than death rate but a positive migration outcome. (Bevölkerung = population, Zahl = number, Gebrtenrate = biirth rate, Sterberate = death rate, Zuwanderung = migration plus, Abwanderung = migration minus, Wieviele Jahre voraus = how many years forcasting)
Bevölkerung als Zahl 1000
Geburtenrate in % 0.15
Sterberate in % 0.17
Zuwanderung Zahl 200
Abwanderung Zahl 100
Wieviele Jahre voraus ? 20
Jahr 2019 = Einw. 1000
Jahr 2020 = Einw. 1080
Jahr 2021 = Einw. 1158
Jahr 2022 = Einw. 1235
Jahr 2023 = Einw. 1310
Jahr 2024 = Einw. 1384
Jahr 2025 = Einw. 1456
Jahr 2026 = Einw. 1527
Jahr 2027 = Einw. 1596
Jahr 2028 = Einw. 1665
Jahr 2029 = Einw. 1731
Jahr 2030 = Einw. 1797
Jahr 2031 = Einw. 1861
Jahr 2032 = Einw. 1923
Jahr 2033 = Einw. 1985
Jahr 2034 = Einw. 2045
Jahr 2035 = Einw. 2104
Jahr 2036 = Einw. 2162
Jahr 2037 = Einw. 2219
Jahr 2038 = Einw. 2275
Jahr 2039 = Einw. 2329
EXAMPLE 2
Shows a population with a lower birth rate than death rate and a negative migration outcome. (Bevölkerung = population, Zahl = number, Gebrtenrate = biirth rate, Sterberate = death rate, Zuwanderung = migration plus, Abwanderung = migration minus, Wieviele Jahre voraus = how many years forcasting)
Basisjahr als Zahl ? 2019
Bevölkerung als Zahl 1000
Geburtenrate in % 0.15
Sterberate in % 0.17
Zuwanderung Zahl 100
Abwanderung Zahl 120
Wieviele Jahre voraus ? 30
Jahr 2019 = Einw. 1000
Jahr 2020 = Einw. 960
Jahr 2021 = Einw. 920
Jahr 2022 = Einw. 882
Jahr 2023 = Einw. 844
Jahr 2024 = Einw. 807
Jahr 2025 = Einw. 771
Jahr 2026 = Einw. 736
Jahr 2027 = Einw. 701
Jahr 2028 = Einw. 667
Jahr 2029 = Einw. 634
Jahr 2030 = Einw. 601
Jahr 2031 = Einw. 569
Jahr 2032 = Einw. 538
Jahr 2033 = Einw. 507
Jahr 2034 = Einw. 477
Jahr 2035 = Einw. 447
Jahr 2036 = Einw. 418
Jahr 2037 = Einw. 390
Jahr 2038 = Einw. 362
Jahr 2039 = Einw. 335
Jahr 2040 = Einw. 308
Jahr 2041 = Einw. 282
Jahr 2042 = Einw. 256
Jahr 2043 = Einw. 231
Jahr 2044 = Einw. 206
Jahr 2045 = Einw. 182
Jahr 2046 = Einw. 159
Jahr 2047 = Einw. 135
Jahr 2048 = Einw. 113
Jahr 2049 = Einw. 90

LEARNING ENVIRONMENT
For an overview of all posts in this block about programming with python 3 see HERE.
